
Sidebar
Index
start:reports:sales:weekly:weekly_score_card
Weekly Scorecard
In this tutorial I am going to show you how to view your weekly scorecard.
To begin click on the menu button located in the top left hand corner of your screen, followed by reports, followed by sales, followed by weekly and then followed by weekly scorecard.
If you are a multi branch store your first step is to select your branch by clicking on the drop down filter entitled ‘select branch’.
Once the page has loaded you then need to select a date range by clicking on the button entitled ‘filter date’. Once you have selected your date simply click ‘change date range’ and your page will refresh with the relevant information.
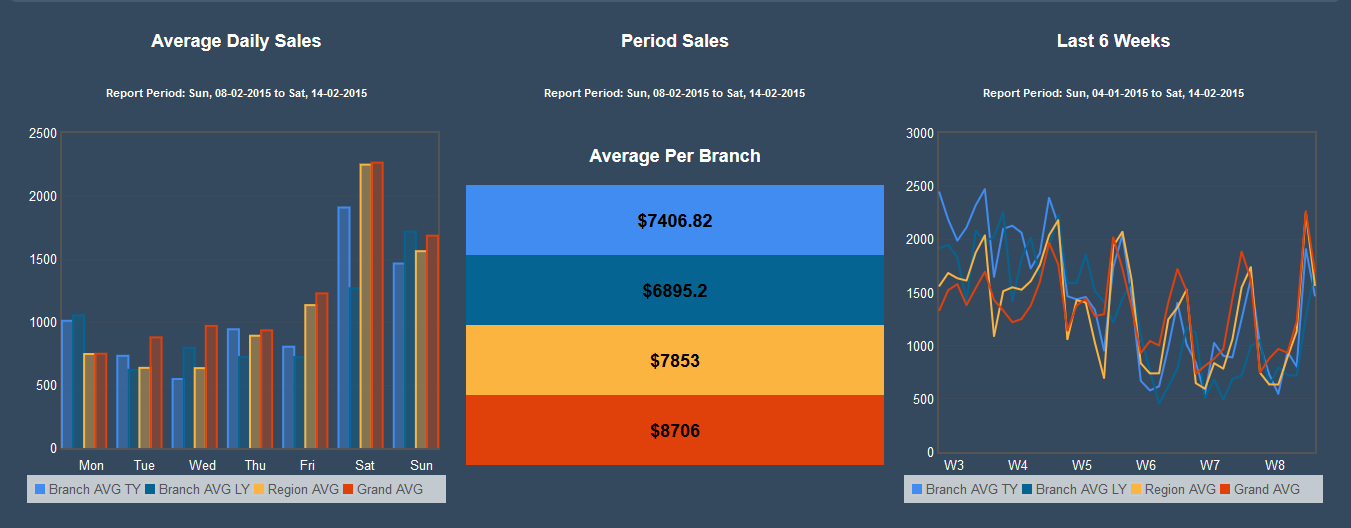
When the page has completely loaded you will notice three separate pieces of information representing; average daily sales, period sales and sales from the last 6 weeks.
Each of these pieces of information is then broken into four categories, those being;
- Average branch sales this year
- Average branch sales last year
- Average for the region
- Grand average
This information is color coordinated to aid in the understanding of the information as a whole.
When looking at the information it is important to note that the diagrams contain information from your store (Branch AVG TY, Branch AVG LY), from the region you are located in (Region AVG) and as an entire company as a whole (Grand AVG).
start/reports/sales/weekly/weekly_score_card.txt · Last modified: 2015/09/18 11:32 by 127.0.0.1