
Sidebar
Index
start:reports:sales:weekly:weekly_kpi
Weekly KPI
(Key Performance Indicator)
In this tutorial I am going to show you how to view your Weekly KPI.
To begin click on the Menu button located in the top left hand corner of your screen, followed by Reports, followed by Sales, followed by Weekly and then Weekly KPI.
If you are a multi branch store your first step is to select the branch to see the information.
Once you are on the page you then need to select a date by clicking on the ‘filter date’ button. When you have chosen your date you need to select the ‘Change Date Range’ button and that will bring up all of the information related to that week.
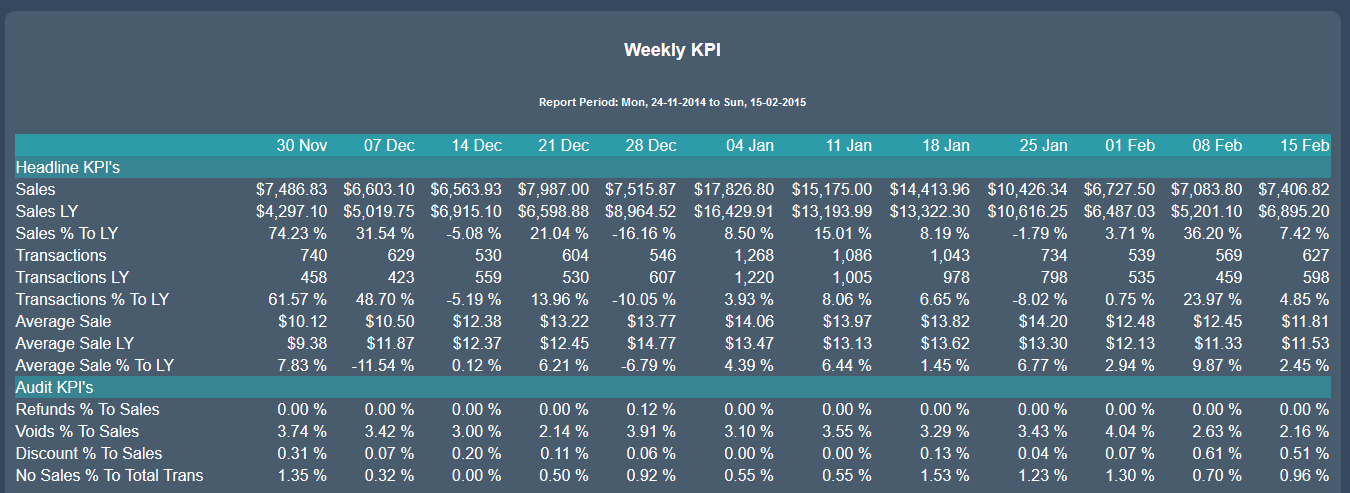
With the table loaded you will then see two sets of information.
The first set of information is once again broken down into three subcategories. These subcategories are Sales, Transactions and Average Sales. Each of these categories has three sets of additional information:
- Sales - representing the current yearly sales
- Sales LY - representing the sales for this time last year
- Sales % to LY - representing the percentage difference between the current year and the previous years sales.
The titles for the transactions and average sales sections have the same meaning as the sales categories above.
The second category contains four separate pieces of information. This includes;
- Refunds % to sales- representing the refunds as a percentage of total sales.
- Voids % to sales- representing the percentage of sales that were voided.
- Discount % to sales- representing the percentage of sales that had a discount applied.
- No sale % to total transactions- representing the percentage of no sales compared to the total number of transactions.
You are also given the option to save the information as an Excel spreadsheet or as a PDF file.

start/reports/sales/weekly/weekly_kpi.txt · Last modified: 2020/03/16 14:42 by Kane