
Sidebar
Index
start:reports:sales:stock:departmentsales
Department Sales
In this tutorial, I am going to show you how to view your total sales for each department via date range.
To begin click on the menu button located in the top left-hand corner of your screen, followed by reports, followed by sales, followed by stock and then followed by Department Sales.
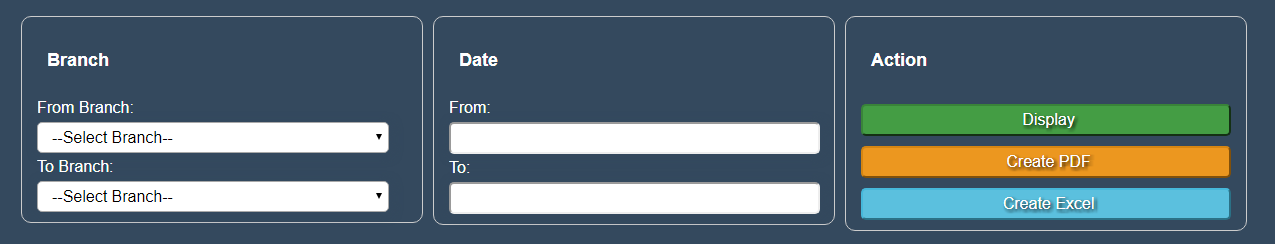
Pick the branches and enter a date range to filter your search.
After you have entered your filter options simply click ‘Display’ and a table will appear in the bottom section of your screen.
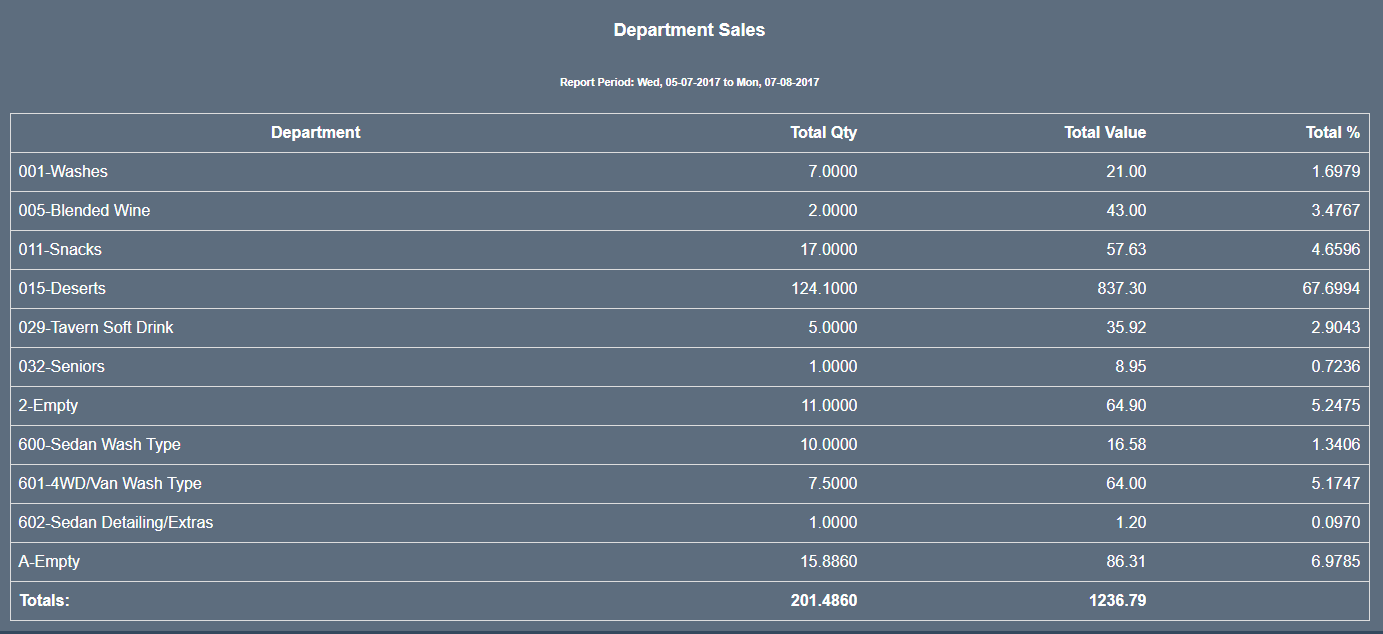
In this table, you will see a break down of all of your departments that sold products during the allocated date range. This sales information is broken down into; the department name, the quantity of that department that has been sold, the total monetary value of the products sold and the percentage break down of the total value for each department.
You are also given the option to save the information as an Excel spreadsheet or as a PDF file for printing or for physical use at a later stage.
start/reports/sales/stock/departmentsales.txt · Last modified: 2017/08/07 10:19 by 127.0.0.1