
Sidebar
Index
start:branch_admin:sensors:sensor_data_overview
Sensor Data Overview
In this tutorial I am going to show you how to view your sensor data.
IT IS IMPORTANT TO NOTE THAT YOU MUST COMPLETE THE CONTROLLER AND SENSOR SETUP PRIOR TO ACCESSING THIS PAGE.
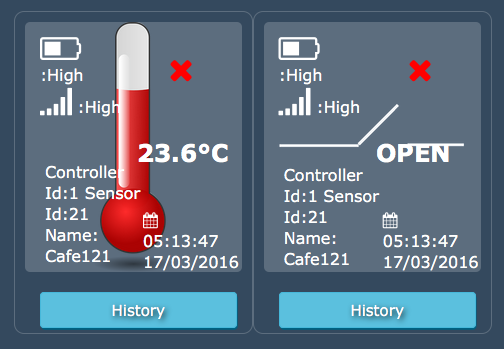
To begin click on the menu button located in the top left hand corner of your screen, followed by branch admin, followed by sensors and then followed by Sensors data overviews. Once on this screen you will be presented with two lots of information per controller/sensor. For each device you are given information corresponding to the controller and sensor ID, sensor name, battery and signal levels and temperature. You are also shown whether the sensor is opened or closed as well as whether the sensors are active or not with the use of a cross or a tick. You are also shown the last time and date that the device has been updated.
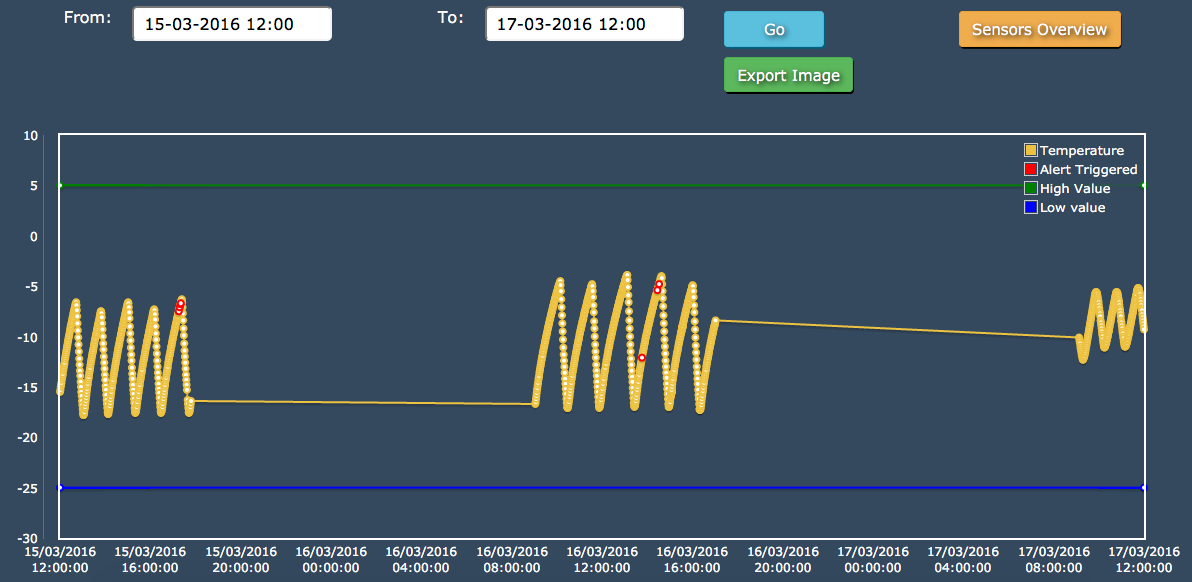
To receive further information click on the button labeled history. This will then move you to a new page where you will see a detailed graph showing the devices information. Within this graph you will notice a reference table in the top right hand corner. This table allows for you to examine the basic information when it comes to your sensors.
Above the table you also have the option to change the time and date range as well as export the graph as a PNG file. (FOR MAC USERS IT IS IMPORTANT TO NOTE THAT YOU MUST SAVE THE FILE TO YOUR DOWNLOADS FOLDER AND OPEN IT FROM THE FINDER, NOT FROM THE DOWNLOADS TAB IN YOUR SEARCH ENGINE). The final option allows you to return to the main screen by clicking on the button entitled sensor overview.
start/branch_admin/sensors/sensor_data_overview.txt · Last modified: 2016/03/18 11:16 by 127.0.0.1