
Sidebar
Index
start:reports:sales:sales_analysis
This is an old revision of the document!
Sales Analysis
In this tutorial I am going to show you how to view your Sales Analysis.
To begin click on the menu button located in the top left hand corner of your screen, followed by reports, followed by sales and then followed by sales analysis.
Once the page has loaded you then need to choose your date range by selecting the filter date button. Once you have selected both your start and end date you simply click ‘change date range’ and your screen will refresh with the relevant information.
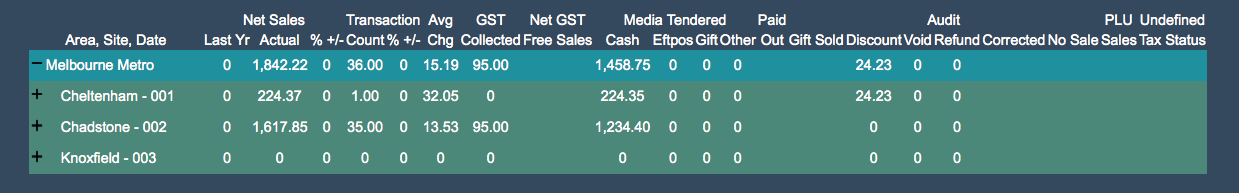
Going across the screen from left to right there are 10 different pieces of information.
- The first column represents information regarding the net sales from last year and this year in accordance to the date range. It also shows the percentage difference between the two years.
- The second column shows the amount of transactions that have occurred during that time period. It then shows you the percentage difference between that same time period from the previous year.
- The third column along shows the average charge in relation to the time period selected.
The remaining 7 columns will only show relevant information if they were set up correctly.
- the forth column will depict the total amount of GST collected.
- The firth column will represent the total amount of sales that are GST free.
- The sixth column is broken into 3 sub columns each representing the total transactions paid by; cash, eftpos, gift cards or by other methods of purchase.
- The seventh column represents the amount of money that has been paid from the till. This generally relates to money spend paying supplier’s or removing money from the till for banking purposes.
- The eighth column along represents the total number of gift cards sold during the designated period.
- The ninth column is another group of information that is broken down into 5 sub columns each representing; discounts, voids, refunds, corrections and no sales for the purpose of an audit.
- The tenth and final column represents the sales of those products that had an unknown PLU code.
For those businesses with multiple branches the plus icon (+) allows for you to expand all of this information to see the breakdown from each of your stores.
From this expansion you can then once again expand the individual store information to see the exact break down of the 10 columns.
Formulae
% +/- = (((Current Year - Last Year) / Last Year) * 100)
start/reports/sales/sales_analysis.1558420053.txt.gz · Last modified: 2019/05/21 16:27 by Troy