Monthly KPI
(Key Performance Indicator)
In this tutorial I am going to show you how to view your Monthly KPI.
To begin click on the menu button located in the top left hand corner of your screen, followed by reports, followed by sales, followed by monthly and then followed by monthly KPI.
If you are a multi branch store you then need to select your date range by clicking on the drop down feature next to ‘select a branch’.
As this information is depicted on a monthly basis it is not crucial to select a date range, as the information from the last 12 months will appear automatically.
It is important to note that when selecting the date range that the date you choose will be the end date. Therefore all of the information 12 months prior to that date will be displayed.
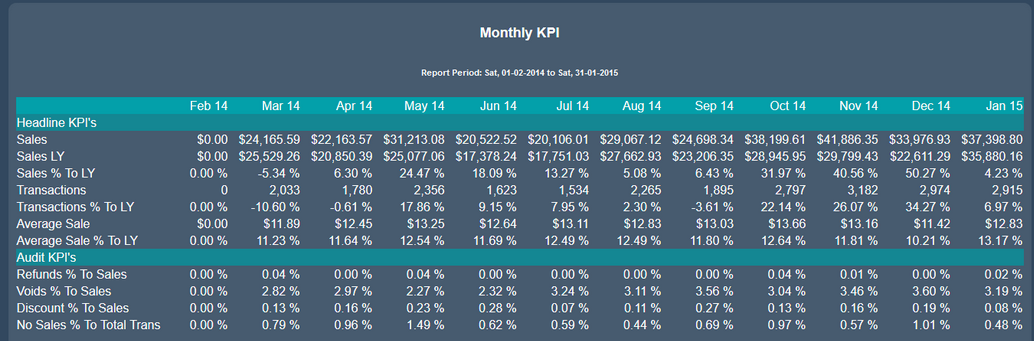
With the table loaded you will then see two sets of information.
The first set of information is once again broken down into three sub categories. These categories include; Sales, Transactions and Average Sales.
Each of these categories has three sets of additional information added to it. these are;
- Sales- representing the current years sales
- Sales LY- representing the sales for this time last year
- Sales % to LY- representing the percentage difference between the current year and the previous years sales.
These subcategories stay the same for transactions and average sales.
The second category contains four separate pieces of information. This includes;
- Refunds % to sales- representing the percentage of refunds and the amount of sales.
- Voids % to sales- representing the percentage of voids and the amount of sales.
- Discount % to sales- representing the percentage of discounts compared to the amount of sales.
- No sale % to total transactions- representing the percentage of no sales compared to the total number of transactions.
You are also given the option to save the information as an Excel spreadsheet or as a PDF file for printing or for physical use at a later stage.